How to Implement Composite Security in Power BI - RLS for Paginated Report Visualizations
/There are two types of reports in Power BI, the standard .pbix type which is native to the Power BI desktop and service, and then you have the paginated report type or .rdl, this type of report can only be created in Power BI Report Builder, a stand-alone tool for the desktop. You might recognize the .rdl extension from SSRS and that is because the Power BI Report Builder is just a lightweight version of SSRS. As great as Power BI is, we still have the need for paginated reports--pixel perfect reports intended for printing, rich data export options, or filtered, near real-time analysis of operational data. Microsoft continues to make moves to consolidate the SSRS features in to Power BI, but it is still a work in progress (as of 2023.02.03).
Microsoft introduced the paginated report visualization to Power BI in 2021 and it has been receiving more attention as of late, but the paginated integration with Power BI still has some glaring limitations and issues we assume will be worked out in the coming months. For a paginated report built on a Power BI dataset, it's not possible to call that paginated report from another Power BI report and pass down filters from the Power BI report to the paginated report. Well you can pass them down but they don't actually filter the data as you would expect. When you pass down filters to a paginated report that is built on a Power BI dataset it returns all data from the underlying dataset and then applies the filter. For very large datasets that just won't work.
Problem Statement
Our report consumers want to be able to export data in different formats without some of the inherent limitations of exporting a single visualization in Power BI. Because our source data is so large, we need to be able to pass in filters to limit the amount of data we are returning to the client. We also want to preserve the Power BI user experience our report consumers are accustomed to with features like searchable parameters and a more presentable user interface.
The solution we present here is not ideal, but rather a workaround until Microsoft can address some of these issues. You will see that even with the workaround, there are yet additional limitations to that as well, but this does solve a lot of our problems for now.
Paginated Reports in Power BI Desktop
Before we can call a paginated report using the paginated report visualization in Power BI, we first need to create a parameterized paginated report. We assume you all know how to do that already so we won't get in to the details of that. Once we have built the paginated report, we are now ready to call it from Power BI.
Open Power BI desktop and create a new report. Since the target paginated report we want to call accepts parameters, we first need to make sure we have a dataset defined in the Power BI report, from that dataset we will pull the filter parameters to pass down to the paginated report.
Because of the way Power BI processes filters, the filters you want to send to the paginated report, your filters must be related. This can present some challenges depending on how many filters your target report has since the greater number of filters means a larger cartesian product. Let me explain.
If the paginated report accepts 3 parameters - merchant, start date, and end date, then we need to pass those from the Power BI report and dataset. The same way we used to create datasets in SSRS with values that would populate a parameter in the report, we are doing the same thing here. First we create a table from a SQL query for all merchants and then we create a second table from SQL query for dates. We don't use a full dates table here because of the cartesian product we mentioned earlier (we will get in to the details of that next). Instead of a full range of dates we create the following:
SELECT
   CONCAT(SUBSTRING(DATENAME(mm, MIN(CalendarDate)), 1, 3), '-', DATEPART(yy,MIN(CalendarDate))) AS DateLabel
  ,MIN(CalendarDate) AS StartDate
  ,MAX(CalendarDate) AS EndDate
  ,ROW_NUMBER() OVER (ORDER BY MIN(CalendarDate) ASC) + 3 AS SortOrder -- plus the number of relative date attributes
  ,1 AS CommonKey
FROM dbo.DateDim
WHERE CalendarDate > DATEADD(DAY, -365, CAST(GETDATE() AS date)) AND CalendarDate <= CAST(GETDATE() AS date)
GROUP BY YearMonthName

UNION
SELECT
'Yesterday' AS DateLabel
,CAST(DATEADD(DAY, -1, GETDATE()) AS date) AS StartDate
,CAST(DATEADD(DAY, -1, GETDATE()) AS date) AS EndDate
,0 AS SortOrder
,1 AS CommonKeyUNIONSELECT
'Today' AS DateLabel
,CAST(GETDATE() AS date) AS StartDate
,CAST(GETDATE() AS date) AS EndDate
,1 AS SortOrder
,1 AS CommonKeyUNIONSELECT
'Last 7 Days' AS DateLabel
,CAST(DATEADD(DAY, -7, GETDATE()) AS date) AS StartDate
,CAST(GETDATE() AS date) AS EndDate
,2 AS SortOrder
,1 AS CommonKeyUNIONSELECT
'Last 30 Days' AS DateLabel
,CAST(DATEADD(DAY, -30, GETDATE()) AS date) AS StartDate
,CAST(GETDATE() AS date) AS EndDate
,3 AS SortOrder
,1 AS CommonKey
ORDER BY SortOrder, StartDateThis provides a good number of relative date slices representing the most common ways the data is interacted with. Now on to how we relate all this and why the number of records in each table matters.
Each table needs to be related in order for us to pass values from the different table down to the paginated report as input parameters. Because there is no relationship between merchants and dates, we will need to manufacture one with a common key. So in addition to the merchant and dates table we are also going to create a common key table. This common key or bridge table allows us to relate the otherwise unrelated tables. Create a common key attribute in each of your three tables and then create relationships between each of the three tables on that key. Because of the way these need to relate, you will need filtering in both directions and depending on how many parameters you have, many to many relationships even if there is only a single record in the bridge table. This is what we were referring to with the cartesian product, its why we want to limit the number of rows in a table used for parameter filtering.
Once you have set this up your report model will look something like this:
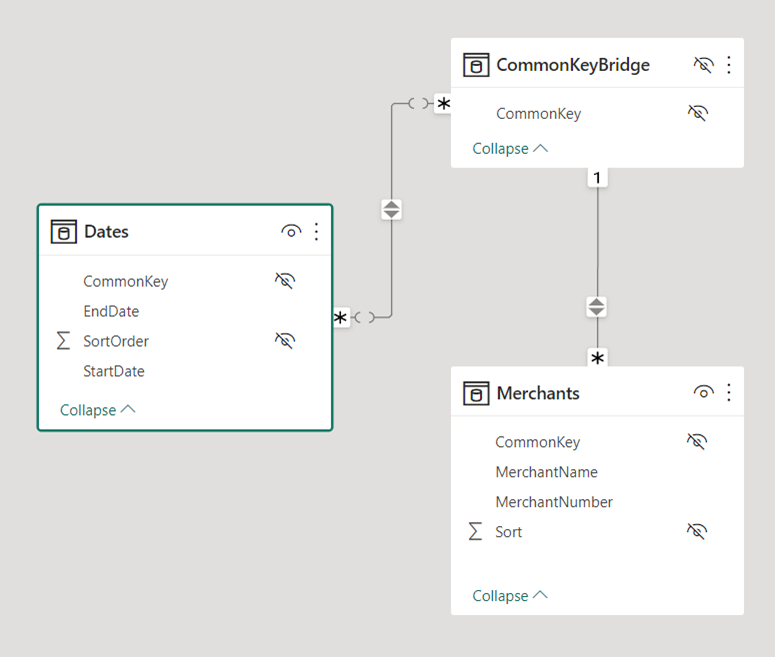
The way we setup this up is a requirement to be able to connect your parameters to the target paginated report. If you do not do this correctly you will receive errors when you try to define your filter parameters for the paginated report.
Go back to your report view in your Power BI report and drag a few slicers to the report page. One slicer will list all merchants and the other will list the user friendly date labels you defined in your dates table. While you might think this is what gets passed to the paginated report its not actually. This is just filtering the data for the underlying parameter values we will map in the next step.
When working in Power BI desktop and you add the paginated report visualization to the canvas you will be presented with the following message:

Before we can connect to the target report we first need to define the report parameters in the Power BI report. When you have the paginated report visualization highlighted you will now see a parameters group in your Visualization tree where we can select the values we want to pass in as parameters to the paginated report. We have added our merchant number and start and end dates.

Once our parameters are defined make sure you are logged in to Power BI with a user account that has access to your organization's Power BI tenant. We are now ready to click the Connect to Report button that appears when we pulled the paginated report visualization on to the canvas. Click the connect to report button and we will be directed to a list of all paginated reports we have access to in our organization. This assumes we already have paginated reports deployed to our Power BI service, which we do, if not you'll want to create and publish one first. When you select a report from the target workspace we will then see an option to set the report parameters.

What is happening here is Power BI wants to know what values in the Power BI desktop report you want to pass in as parameters defined in the paginated report. We already defined our Power BI report parameters in a previous step, now we are ready to tie it all together. In the following image you can see we mapped the target parameter to the parameters we created in the Power BI report. If you set this up correctly you should be able to click the See Report button and the paginated report will be returned in the paginated visualization window.

Row Level Security (RLS)
One of the nice features of using this pattern is we can apply RLS to the merchant table the same way we would on any other table in a Power BI report model. We can might use the USERNAME() or CUSTOMDATA() functions to filter the merchant table down to just what the report user needs to see. We have a security modifier in our merchant table query we can use to set the correct filter context based on the current user. The difficult part of building this pattern has less to do with the RLS piece and more to do with the constraints around pass through filtering for a paginated report visualization.
In addition to RLS security the paginated report can have another layer of security baked in to the code for its underlying datasets, the same way you would have set it up for SSRS reports in the past. In SSRS there is a built-in field for the current user ([&UserID]) and you can use this to filter your report by joining to a dataset in your database that has permissions defined for the different users, a common pattern for this type of report.
So between RLS in your Power BI calling report, data filtering on UserId in your paginated report, you can be sure that users only have access to the data they are supposed to see.